Developed by Steven T. Kalinowski and Shannon Willoughby
| Purpose | To provide a quantitative measure of the relative formal reasoning ability of students in introductory science classrooms. |
|---|---|
| Format | Multiple-choice |
| Duration | 20 min |
| Focus | Scientific reasoning (hypothesis testing, correlational reasoning, probability, control of variables, proportional reasoning) |
| Level | Intro college |


FORT Implementation and Troubleshooting Guide
Everything you need to know about implementing the FORT in your class.
Login or register to download the implementation guide.
more details
This is the second highest level of research validation, corresponding to at least 5 of the validation categories below.
Research Validation Summary
Based on Research Into:
- Student thinking
Studied Using:
- Student interviews
- Expert review
- Appropriate statistical analysis
Research Conducted:
- At multiple institutions
- By multiple research groups
- Peer-reviewed publication
The questions on the FORT came from a variety of other existing assessments including the Classroom Test of Scientific Reasoning, the online test bank for the American Association for the Advancement of Science and the published literature. The created several versions of the assessment, gave them to students in introductory college courses and analyzed the results using item response theory (IRT), looking for questions with strong discrimination. They also tested several other versions of the FORT with students and used IRT to estimate the difficulty, discrimination, and guessing rate for each question. To determine the final version of the FORT, the developers looked at how individual questions influenced the reliability of the test and chose the best combination. During development, the FORT was given to over 9000 students in introductory science courses at a nine institutions. Student interviews were conducted and developers found students were properly understanding the questions and answer choices. The developers also performed a regression analysis to evaluate how well scores on the FORT predicted how well students learned natural selection and found it was a good predictor of student learning. The results of the FORT are published in one peer-reviewed publication.
References
- S. Kalinowski and S. Willoughby, Development and validation of a scientific (formal) reasoning test for college students, J. Res. Sci. Teaching 56 (9), 1269 (2019).
We don't have any translations of this assessment yet.
If you know of a translation that we don't have yet, or if you would like to translate this assessment, please contact us!
| Typical Results |
|---|
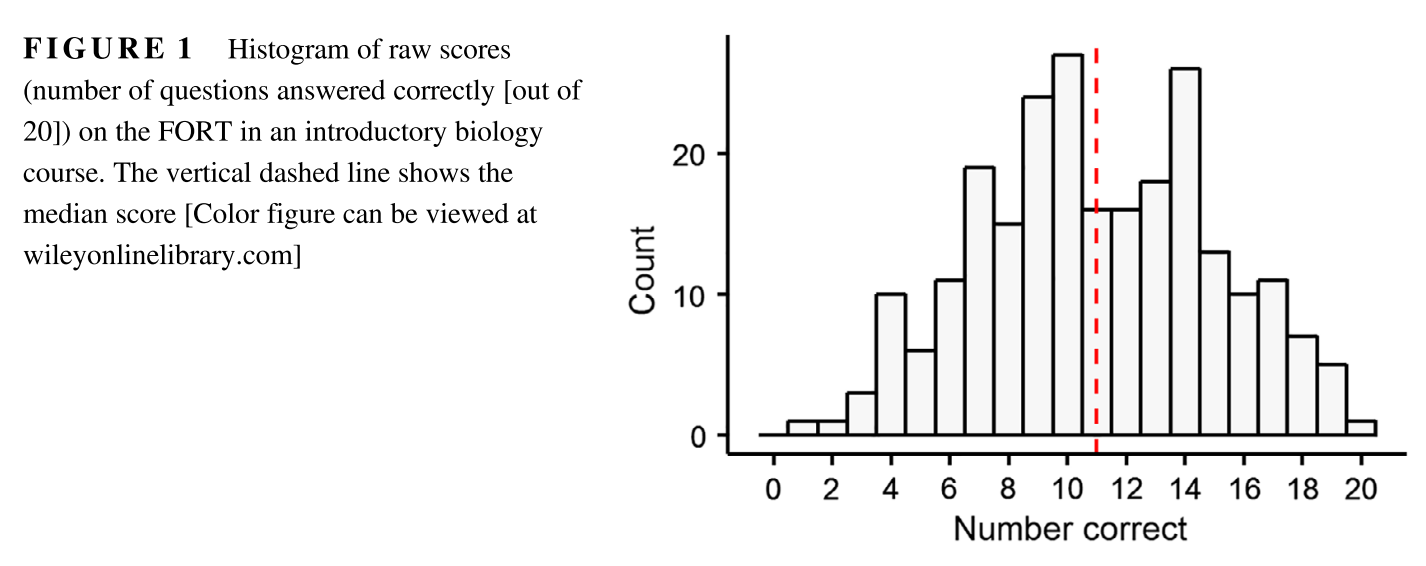
Figure 1 (Kalinowski and Willoughby 2019) showing the distribution of raw scores on the FORT for 240 students in an introductory biology course. The average score was 0.55 and the median score was 0.60 (12 out 20 questions). The hardest question on the test (wizard hat question) was answered correctly by 15% of the class. The easiest question on the test (six marbles) was answered correctly by 82% of the class.
|
The latest version of the FORT, released in 2019, is version 1.


