Normalized gain: What is it and when and how should I use it?
Introduction to normalized gain:
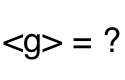
The normalized gain, introduced by Hake 1998 "as a rough measure of the effectiveness of a course in promoting conceptual understanding," has become the standard measure for reporting scores on research-based concept inventories. Hake defined the average normalized gain as:
![]()
where brackets indicate class averages. This measure is commonly described as "the amount students learned divided by the amount they could have learned."
Advantages of normalized gain:
Hake advocated using normalized gain because, for his data, this measure strongly differentiated between teaching methods, but allowed for "a consistent analysis over diverse student populations with widely varying initial knowledge states." That is, it appeared to be independent of population or pre-test scores, allowing instructors to compare their students' learning to those of other students at very different kinds of institutions.
Criticisms of normalized gain:
It may not be independent of student preparation. Coletta and Phillips 2005 called into question the independence of normalized gain and student preparation, finding a "significant, positive correlation between class average normalized FCI gains and class average pre instruction scores". A later metaanalysis of FCI and FMCE scores [Von Korff et al. 2016] did not find a correlation between pre-test scores and normalized gains in the published literature.
It does not account for drop rates. Tom Carter [private communication] has criticized normalized gain as being inappropriate for community colleges and other institutions with large drop rates, because it does not measure the learning of the students who dropped the course, and inflates the perception of effectiveness of a course in which most students who would have gotten low scores on the post-test have dropped the course. Normalized gain is often used at universities with drop rates of 5-10%, which are too small to have a significant impact on normalized gain. However, some community colleges have drop rates as high as 50%, so normalized gain is not accounting for a large fraction of the students who initially enroll in physics.
It does not account for losses. According to Lasry et al. 2010, normalized gain "implicitly assumes that losses are zero" and does not account for students who score lower on the post-test and on the pre-test. However, they demonstrated that losses are fairly common. His research was inconclusive on whether these losses "represent actual conceptual losses, or... result from correct guesses on the pre-test that, by chance, became incorrect on the post-test" and on whether "these losses change the conclusions that have been drawn using Hake’s gain."
Alternative definitions: Gain of averages vs. average of gains
The literature is filled with alternative ways of calculating normalized gain, which may or may not be reported as such, and which may differ from Hake's calculation by as much as 10%. The most common alternative calculation is to calculate the gain for each individual student and then average, rather than than calculating the gain from the class average pre and post scores. Here are the two ways that the average normalized gain for a class is often calculated:
- Gain of averages: First calculate the average pre-test and average post-test score for your class, then take the normalized gain of these: <g> = (<Post> - <Pre>)/(100 - <Pre>)
- Average of gains: First calculate the normalized gain for each student, then average these: gave = <(Post - Pre)/(100 - Pre)>
According to Hake 1998 and Bao 2006, the difference between these two calculations is not significant for large classes, but may differ quite a bit for small classes. The gain of averages is the official definition given by Hake, but many researchers use the average of gains instead. For example, it is used in the Assessss spreadsheet, a commonly used tool for calculating scores on concept inventories (which verified educators can download from the scoring tab of the PhysPort FCI page), and in the official PhysTEC recommendations. The Von Korff et al. meta-analysis found that most studies reporting normalized gains do not explicitly state which of these two calculations they used, and in private communications or examination of spreadsheets, we have found that even when authors report the equation for the gain of averages, they are actually calculating the average of gains.
Advantages to calculating gain of averages <g> = (<Post>-<Pre>)/(100-<Pre>)
- It is the "standard" definition of normalized gain, according to Hake.
- It is the only thing you can calculate if you don't have individual student scores, but do have class average scores.
- It is still well-defined and averages out to something reasonable even if some students score 100% on the pre-test or have scores that go down slightly from pre-test to post-test. For the other measure, you have to either drop these students or use normalized change.
Advantages to calculating average of gains gave=<(Post-Pre)/(100-Pre)>
- It is probably very commonly used, possibly even more commonly used than the official definition.
- It forces you to used matched data.
- You can meaningfully relate individual student gains to class average gains. If you plot a histogram of individual students' gains, the mean of this histogram will be the class average gain.
- For normalized change (see below), Marx and Cummings argue that calculating cave than is better than <c> because it makes gains more important than losses, and also because it more accurately captures the spread.
In the PhysPort Data Explorer we use the average of gains so that we can meaningfully compare individual student gains to class average gains.
Alternative definitions: Normalized Change
Marx and Cummings 2007 suggest calculating "normalized change", which is similar to the "average student normalized gain" but removes students who score 0 or 100% on both the pre-test and the post-test, and uses a different calculation for students with negative gains:
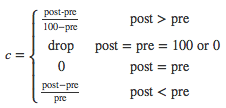
This is what we use in the PhysPort Data Explorer.
Matched data
Most researchers now advocate that the calculation should include only data for students who took both the pre- and post-test, commonly referred to as "matched" data, to avoid inflating the gain by including only the pre-scores of students who dropped or stopped attending class. However, Hake does not mention the need for matched data, and according to the unpublished companion paper to his 1998 study, only about half of the gains reported in that study used matched data. The Von Korff et al. meta-analysis found that most studies reporting normalized gains do not mention whether they use matched data, so we should not assume that they do.
 Add a Comment